


Download PDF

Greenway visualizes vital lab results and clinical data using FusionCharts
Technology Category
- Application Infrastructure & Middleware - Data Visualization
- Platform as a Service (PaaS) - Data Management Platforms
Applicable Industries
- Healthcare & Hospitals
Applicable Functions
- Product Research & Development
Services
- Software Design & Engineering Services
The Challenge
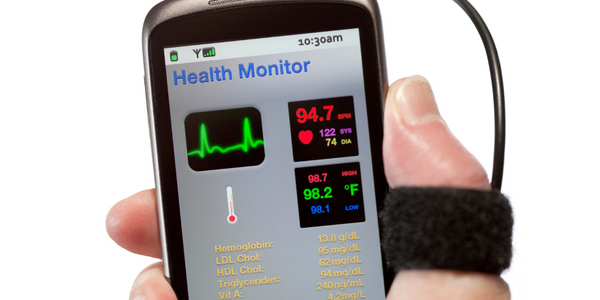
Greenway Medical Technologies, a provider of integrated EHR, interoperability solutions, and on-demand services for healthcare institutions, needed a way to visually represent lab results and clinical data. Their flagship application, PrimeSuite, integrates all clinical, financial, and administrative workflows into a single database to promote information sharing and ensure quick adoption. However, they needed a solution that could convert the monotonous data into exciting visuals, making it easier for users to analyze the data and quickly recognize any trends.
About The Customer
Greenway Medical Technologies is a provider of integrated EHR, interoperability solutions, and on-demand services for physician practices, hospitals, IDNs, RHIOs, and IPAs. Their solutions increase care quality and enhance patient satisfaction all while maximizing profitability. Their flagship application, PrimeSuite, is an integrated EHR, practice management, and interoperability solution that integrates all clinical, financial, and administrative workflows into a single database to promote information sharing and ensure quick adoption.
The Solution
After six months of extensive web-based research for a charting component, Greenway settled on FusionCharts. FusionCharts helps create animated and interactive Flash charts for web and desktop applications, livening up applications by converting monotonous data into exciting visuals. The Greenway team and their users were highly satisfied with the end results that FusionCharts generated. They have been using FusionCharts successfully for over 2 years now and intend to use it for their next product which needs charting too.
Operational Impact
Quantitative Benefit
Related Case Studies.

Case Study
Hospital Inventory Management
The hospital supply chain team is responsible for ensuring that the right medical supplies are readily available to clinicians when and where needed, and to do so in the most efficient manner possible. However, many of the systems and processes in use at the cancer center for supply chain management were not best suited to support these goals. Barcoding technology, a commonly used method for inventory management of medical supplies, is labor intensive, time consuming, does not provide real-time visibility into inventory levels and can be prone to error. Consequently, the lack of accurate and real-time visibility into inventory levels across multiple supply rooms in multiple hospital facilities creates additional inefficiency in the system causing over-ordering, hoarding, and wasted supplies. Other sources of waste and cost were also identified as candidates for improvement. Existing systems and processes did not provide adequate security for high-cost inventory within the hospital, which was another driver of cost. A lack of visibility into expiration dates for supplies resulted in supplies being wasted due to past expiry dates. Storage of supplies was also a key consideration given the location of the cancer center’s facilities in a dense urban setting, where space is always at a premium. In order to address the challenges outlined above, the hospital sought a solution that would provide real-time inventory information with high levels of accuracy, reduce the level of manual effort required and enable data driven decision making to ensure that the right supplies were readily available to clinicians in the right location at the right time.

Case Study
Gas Pipeline Monitoring System for Hospitals
This system integrator focuses on providing centralized gas pipeline monitoring systems for hospitals. The service they provide makes it possible for hospitals to reduce both maintenance and labor costs. Since hospitals may not have an existing network suitable for this type of system, GPRS communication provides an easy and ready-to-use solution for remote, distributed monitoring systems System Requirements - GPRS communication - Seamless connection with SCADA software - Simple, front-end control capability - Expandable I/O channels - Combine AI, DI, and DO channels
Case Study
Driving Digital Transformations for Vitro Diagnostic Medical Devices
Diagnostic devices play a vital role in helping to improve healthcare delivery. In fact, an estimated 60 percent of the world’s medical decisions are made with support from in vitrodiagnostics (IVD) solutions, such as those provided by Roche Diagnostics, an industry leader. As the demand for medical diagnostic services grows rapidly in hospitals and clinics across China, so does the market for IVD solutions. In addition, the typically high cost of these diagnostic devices means that comprehensive post-sales services are needed. Wanteed to improve three portions of thr IVD:1. Remotely monitor and manage IVD devices as fixed assets.2. Optimizing device availability with predictive maintenance.3. Recommending the best IVD solution for a customer’s needs.

Case Study
HaemoCloud Global Blood Management System
1) Deliver a connected digital product system to protect and increase the differentiated value of Haemonetics blood and plasma solutions. 2) Improve patient outcomes by increasing the efficiency of blood supply flows. 3) Navigate and satisfy a complex web of global regulatory compliance requirements. 4) Reduce costly and labor-intensive maintenance procedures.

Case Study
Harnessing real-time data to give a holistic picture of patient health
Every day, vast quantities of data are collected about patients as they pass through health service organizations—from operational data such as treatment history and medications to physiological data captured by medical devices. The insights hidden within this treasure trove of data can be used to support more personalized treatments, more accurate diagnosis and more advanced preparative care. But since the information is generated faster than most organizations can consume it, unlocking the power of this big data can be a struggle. This type of predictive approach not only improves patient care—it also helps to reduce costs, because in the healthcare industry, prevention is almost always more cost-effective than treatment. However, collecting, analyzing and presenting these data-streams in a way that clinicians can easily understand can pose a significant technical challenge.
