


Download PDF
Jacksonville State University Optimizes Productivity with Tableau
Technology Category
- Application Infrastructure & Middleware - Data Visualization
Applicable Industries
- Education
Applicable Functions
- Business Operation
Services
- Data Science Services
The Challenge
Jacksonville State University's Office of Institutional Research and Assessment, a team of four, was tasked with collecting and analyzing organizational data to optimize operations across nearly 100 academic and non-academic departments. The team struggled with making credit hour productivity visible to departments and administrators, which involved identifying trends in student preference in the academic schedule. The goal was to create optimal course calendars from term to term based on a solid understanding of the data. However, the use of spreadsheets for this task proved to be inefficient and time-consuming, preventing the team from producing meaningful results in time for optimal decision-making. The team was unable to easily identify trends, such as the popularity of 8am classes over the same course at 3pm, leading to missed opportunities to adjust the schedule to meet the needs of the diverse student body.
About The Customer
Jacksonville State University (JSU) is a public university located in Jacksonville, Alabama. The university hosts over 10,000 students annually from Alabama, the southeast, and overseas. The university is composed of nearly 100 academic and non-academic departments with over 1,000 faculty and staff. The Office of Institutional Research and Assessment, a team of four, is responsible for collecting and analyzing organizational data to facilitate smooth operations across the university. The Director of the office, Dr. Alicia Simmons, is a JSU graduate who has been with the university for over 20 years.
The Solution
To overcome the challenges of data analysis and visualization, JSU turned to Tableau Software. This solution allowed the team to save time and resources by providing a platform for systematic support to many different departments and increasing the productivity of the department. With Tableau, the team was able to conduct analyses in a fraction of the time it took with spreadsheets. Moreover, they were able to perform analyses that were previously impossible. The software enabled JSU to visually analyze its master schedule and identify opportunities to increase credit hour productivity. With everyone having the same view and access to the same data, decision-making was accelerated. Data could be analyzed in nearly real-time, allowing patterns to be corrected in time for the start of the next term.
Operational Impact
Quantitative Benefit
Related Case Studies.

Case Study
IoT platform Enables Safety Solutions for U.S. School Districts
Designed to alert drivers when schoolchildren are present, especially in low-visibility conditions, school-zone flasher signals are typically updated manually at each school. The switching is based on the school calendar and manually changed when an unexpected early dismissal occurs, as in the case of a weather-event altering the normal schedule. The process to reprogram the flashers requires a significant effort by school district personnel to implement due to the large number of warning flashers installed across an entire school district.
Case Study
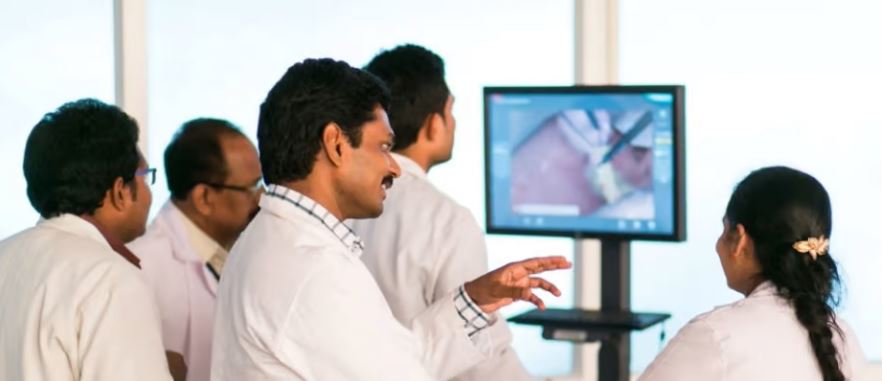
Revolutionizing Medical Training in India: GSL Smart Lab and the LAP Mentor
The GSL SMART Lab, a collective effort of the GSL College of Medicine and the GSL College of Nursing and Health Science, was facing a challenge in providing superior training to healthcare professionals. As clinical medicine was becoming more focused on patient safety and quality of care, the need for medical simulation to bridge the educational gap between the classroom and the clinical environment was becoming increasingly apparent. Dr. Sandeep Ganni, the director of the GSL SMART Lab, envisioned a world-class surgical and medical training center where physicians and healthcare professionals could learn skills through simulation training. He was looking for different simulators for different specialties to provide both basic and advanced simulation training. For laparoscopic surgery, he was interested in a high fidelity simulator that could provide basic surgical and suturing skills training for international accreditation as well as specific hands-on training in complex laparoscopic procedures for practicing physicians in India.
Case Study
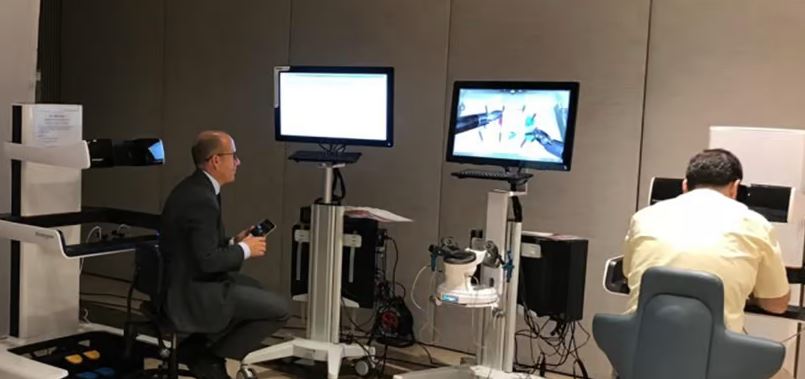
Implementing Robotic Surgery Training Simulator for Enhanced Surgical Proficiency
Fundacio Puigvert, a leading European medical center specializing in Urology, Nephrology, and Andrology, faced a significant challenge in training its surgical residents. The institution recognized the need for a more standardized and comprehensive training curriculum, particularly in the area of robotic surgery. The challenge was underscored by two independent studies showing that less than 5% of residents in Italian and German residency programs could perform major or complex procedures by the end of their residency. The institution sought to establish a virtual reality simulation lab that would include endourological, laparoscopic, and robotic platforms. However, they needed a simulator that could replicate both the hardware and software of the robotic Da Vinci console used in the operating room, without being connected to the actual physical console. They also required a system that could provide both basic and advanced simulation training, and a metrics system to assess the proficiency of the trainees before they performed surgical procedures in the operating theater.

Case Study
Edinburgh Napier University streamlines long-distance learning with Cisco WebEX
• Geographically dispersed campus made in-person meetings costly and inconvenient.• Distance-learning programs in Malaysia, India, and China required dependable, user-friendly online tools to maximize interaction in collaborative workspaces.• Virtual learning environment required a separate sign-in process, resulting in a significant administrative burden for IT staff and limited adoption of collaboration technology.

Case Study
8x increased productivity with VKS
Before VKS, a teacher would spend a lot of time showing a group of 22 students how to build a set of stairs within a semester of 120 hours. Along with not leaving the teacher much time to provide one-on-one support for each student to properly learn carpentry, it also left a considerable amount of room for error. Key information would be misinterpreted or lost as the class was taught in the typical show-and-tell way.

Case Study
Scalable IoT Empowering GreenFlex's Sustainable Growth
GreenFlex, a company that supports sustainable development, decarbonization, and energy efficiency, faced several challenges in its quest to expand its business. The company needed to deploy a robust and sustainable IoT technology to support its growth. It was crucial for them to monitor and control devices at customer sites in a safe and reliable manner. They also needed to integrate devices across a range of communication protocols and gather and act on data to meet efficiency targets. GreenFlex had previously built IoT capabilities into its digital platform, GreenFlexIQ, to monitor and manage customer sites remotely. However, they soon realized that they needed a new platform to support their ambitions. They needed a platform that could scale to connect more devices for production management and make it easier for the operations team to manage devices in the field.
