


Download PDF
Princeton University Office of Development Sees “A Paradigm Shift” with Tableau
Technology Category
- Application Infrastructure & Middleware - Data Visualization
Applicable Industries
- Education
Applicable Functions
- Business Operation
- Sales & Marketing
Services
- Data Science Services
The Challenge
Princeton University's Office of Development, responsible for initiating and nurturing donor relationships, was struggling with time-consuming, error-prone manual reporting processes. Staffers had to dig through several different reports to answer questions, a process that was not only time-consuming but also prone to mistakes. Viewing data in Excel made it difficult to notice results that didn’t quite make sense—data entry errors or outliers that could indicate significant risks or opportunities. The major gifts team each managed a pool of approximately 200 prospects—far too many people to rely on memory to manage contacts. With no dedicated tools to visualize overall engagement, the office relied on large list reports and manual review of individual records to make sure prospect and donor relationships were adequately tended. The research analytics team was responsible for reporting high-level campaign metrics to university trustees and other top executives, but this was another time-consuming, manual effort.
About The Customer
Princeton University, the fourth-oldest university in the United States, attracts the highest caliber of faculty, staff, and students. The Office of Development at Princeton—the fundraising arm of the university—supports this legacy of excellence through a number of giving programs. The Office of Development plays a significant part in that effort, initiating and nurturing donor relationships. Its work also supports other crucial aspects of Princeton’s mission. The Office of Development maintained in-depth transactional giving data and relationship management data, but staffers often had to dig through several different reports to answer questions—a time-consuming, manual effort with potential for mistakes.
The Solution
The Office of Development at Princeton University adopted Tableau to overhaul their manual reporting processes and develop a more data-driven culture. They started using Tableau on their desktops in 2008, primarily for maps. In 2012, they decided to purchase several professional licenses providing direct access to the Oracle database. Today, the Office of Development has 3 employees authoring data visualizations in Tableau Desktop and approximately 150 staffers and administrators consuming vizzes through Tableau Server. In addition to visualizing data from their Oracle database, Campbell’s team also blends data stored in Excel. They have begun experimenting with blending data from the university’s Exact Target digital marketing automation platform. Typically, the team visualizes approximately a million rows, although some dashboards have included up to 8 million rows of data. For security, they use Active Directory.
Operational Impact
Quantitative Benefit
Related Case Studies.

Case Study
IoT platform Enables Safety Solutions for U.S. School Districts
Designed to alert drivers when schoolchildren are present, especially in low-visibility conditions, school-zone flasher signals are typically updated manually at each school. The switching is based on the school calendar and manually changed when an unexpected early dismissal occurs, as in the case of a weather-event altering the normal schedule. The process to reprogram the flashers requires a significant effort by school district personnel to implement due to the large number of warning flashers installed across an entire school district.
Case Study
Revolutionizing Medical Training in India: GSL Smart Lab and the LAP Mentor
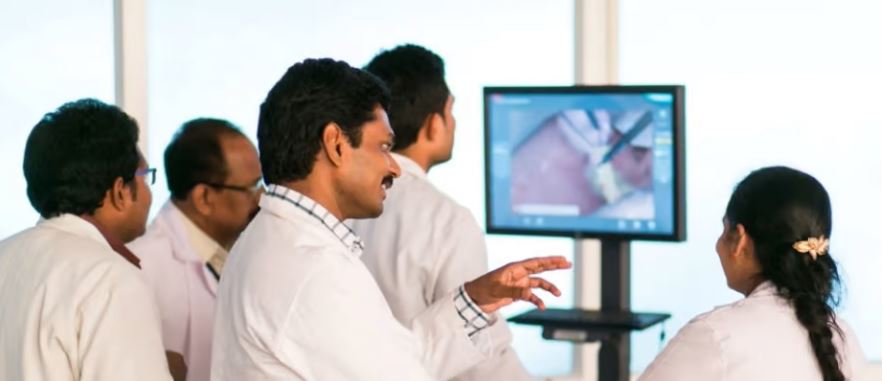
The GSL SMART Lab, a collective effort of the GSL College of Medicine and the GSL College of Nursing and Health Science, was facing a challenge in providing superior training to healthcare professionals. As clinical medicine was becoming more focused on patient safety and quality of care, the need for medical simulation to bridge the educational gap between the classroom and the clinical environment was becoming increasingly apparent. Dr. Sandeep Ganni, the director of the GSL SMART Lab, envisioned a world-class surgical and medical training center where physicians and healthcare professionals could learn skills through simulation training. He was looking for different simulators for different specialties to provide both basic and advanced simulation training. For laparoscopic surgery, he was interested in a high fidelity simulator that could provide basic surgical and suturing skills training for international accreditation as well as specific hands-on training in complex laparoscopic procedures for practicing physicians in India.
Case Study
Implementing Robotic Surgery Training Simulator for Enhanced Surgical Proficiency
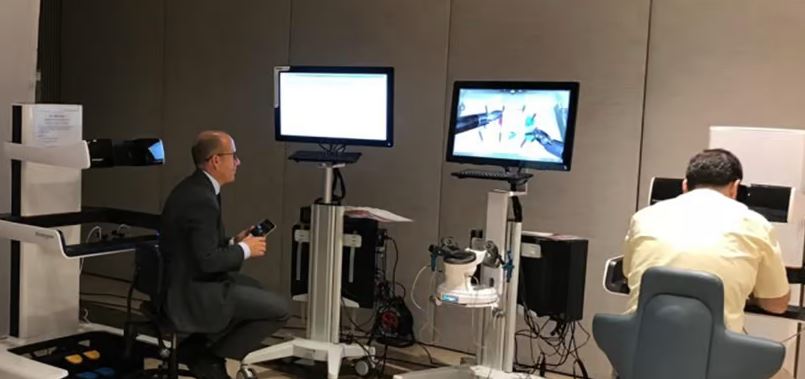
Fundacio Puigvert, a leading European medical center specializing in Urology, Nephrology, and Andrology, faced a significant challenge in training its surgical residents. The institution recognized the need for a more standardized and comprehensive training curriculum, particularly in the area of robotic surgery. The challenge was underscored by two independent studies showing that less than 5% of residents in Italian and German residency programs could perform major or complex procedures by the end of their residency. The institution sought to establish a virtual reality simulation lab that would include endourological, laparoscopic, and robotic platforms. However, they needed a simulator that could replicate both the hardware and software of the robotic Da Vinci console used in the operating room, without being connected to the actual physical console. They also required a system that could provide both basic and advanced simulation training, and a metrics system to assess the proficiency of the trainees before they performed surgical procedures in the operating theater.

Case Study
Edinburgh Napier University streamlines long-distance learning with Cisco WebEX
• Geographically dispersed campus made in-person meetings costly and inconvenient.• Distance-learning programs in Malaysia, India, and China required dependable, user-friendly online tools to maximize interaction in collaborative workspaces.• Virtual learning environment required a separate sign-in process, resulting in a significant administrative burden for IT staff and limited adoption of collaboration technology.

Case Study
8x increased productivity with VKS
Before VKS, a teacher would spend a lot of time showing a group of 22 students how to build a set of stairs within a semester of 120 hours. Along with not leaving the teacher much time to provide one-on-one support for each student to properly learn carpentry, it also left a considerable amount of room for error. Key information would be misinterpreted or lost as the class was taught in the typical show-and-tell way.

Case Study
Scalable IoT Empowering GreenFlex's Sustainable Growth
GreenFlex, a company that supports sustainable development, decarbonization, and energy efficiency, faced several challenges in its quest to expand its business. The company needed to deploy a robust and sustainable IoT technology to support its growth. It was crucial for them to monitor and control devices at customer sites in a safe and reliable manner. They also needed to integrate devices across a range of communication protocols and gather and act on data to meet efficiency targets. GreenFlex had previously built IoT capabilities into its digital platform, GreenFlexIQ, to monitor and manage customer sites remotely. However, they soon realized that they needed a new platform to support their ambitions. They needed a platform that could scale to connect more devices for production management and make it easier for the operations team to manage devices in the field.
