


Download PDF

Using Location Intelligence to Improve Agricultural Sustainability
Technology Category
- Analytics & Modeling - Predictive Analytics
- Analytics & Modeling - Real Time Analytics
- Platform as a Service (PaaS) - Data Management Platforms
Applicable Industries
- Agriculture
Applicable Functions
- Logistics & Transportation
- Quality Assurance
Use Cases
- Predictive Maintenance
- Supply Chain Visibility
Services
- Data Science Services
- System Integration
The Challenge
Indigo Agriculture, a company that works with growers to reimagine the entire agriculture system, faced several challenges in their data-driven approach to business. Their analytics team had to deal with a wide range of internal and external data sources, including internal CRM data from Salesforce, external meteorological datasets, and data collected in the field. The team needed to pull data from existing systems and upload a variety of data formats for collaboration across departments and the creation of a seamless end-to-end experience for customers. Another challenge was turning complex geospatial data into actionable insights for business users. The team sought to provide business users in marketing, sales, and field operations a more intuitive and interactive format for viewing data, instead of relying solely on traditional, tabular data. Lastly, the business units often needed to see prototypes or analysis against tight deadlines. The team needed to quickly bring together data, carry out complex geospatial analysis, and deliver dashboards to ensure geospatial analytics were considered in all business decisions.
About The Customer
Indigo Agriculture is a company founded in 2014 that works with growers to reimagine the entire agriculture system, from soil to sale. Their Grain and Transport Marketplaces help improve grower profitability, environmental sustainability, and consumer health through the use of natural microbiology and digital technologies. In 2019, the company launched Indigo Carbon – a scientifically backed program that provides growers with a new revenue stream in the form of verified agricultural carbon credits. As part of Indigo’s data-driven approach to business, their analytics team gathers, assesses and shares spatial data with internal teams to power decisions across the organization. Indigo created a smooth process to aggregate, analyze, and visualize disparate datasets in user-friendly maps for key stakeholders. CARTO dashboards designed for Indigo’s Carbon program help refine soil carbon measurements, ensuring generation of the highest quality carbon credits for farmers and the brands supporting them.
The Solution
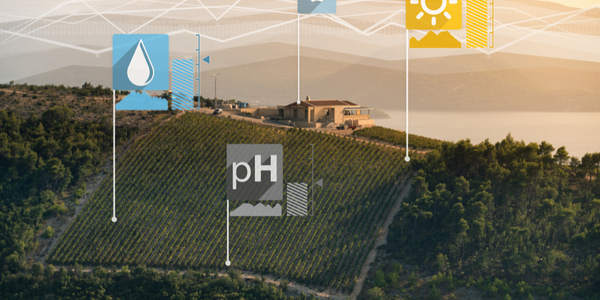
Indigo Agriculture used CARTO Builder, a drag and drop spatial analysis tool, to rapidly create prototypes to support the development and evolution of Indigo Atlas Insights, the technology platform powering its Carbon program, Grain Marketplace, and Transport Marketplace. This solution delivers a living map of the world’s food system, characterizing localized soil conditions, drawing field boundaries to meter-level accuracy, and discerning subtle differences in crop health across a region. With this technological backing, growers can make more informed planting, harvest, and marketing decisions, and gives buyers a greater degree of control and choice over their supply chain. CARTO’s connectivity to Snowflake streamlined Indigo’s process of pulling data to test and develop proof-of-concept features, saving hours of time each week. The connector’s scheduled data syncing elevated dashboards from static snapshots in time to dynamic maps with up-to-date data reflecting the current state of the business that can be revisited in the future. By using CARTOframes, the Indigo team was able to efficiently manage and publish data from spatial models to provide actionable insights for a range of use cases.
Operational Impact
Quantitative Benefit
Related Case Studies.
Case Study
Intelligent Farming with ThingWorx Analytics
Z Farms was facing three challenges: costly irrigation systems with water as a limited resource, narrow optimal ranges of soil moisture for growth with difficult maintenance and farm operators could not simply turn on irrigation systems like a faucet.

Case Study
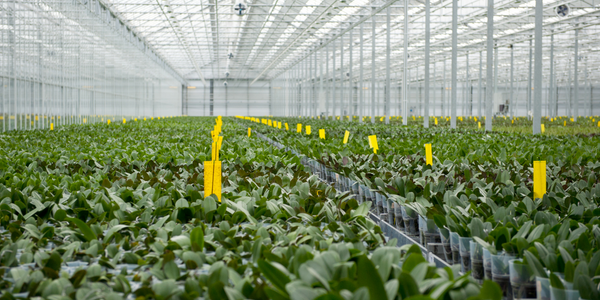
Greenhouse Intelligent Monitoring and Control Solution
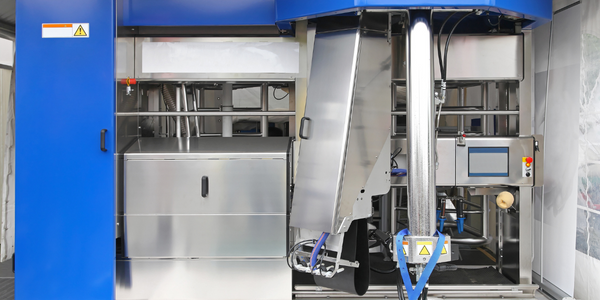
Farming Orchids is the most successful form of precision farming in Taiwan, and also the most exported flower. Orchids need a specific temperature and humidity conditions to grow and bloom, and its flowering time may not be in line with market demands, so the price collapses when there is overproduction. Therefore, some farmers began to import automated greenhouse control systems for breeding and forcing, which not only improves quality, but also effectively controls the production period and yield to ensure revenue. In 2012, an orchid farmer built a Forcing Greenhouse of about 200 pings (approximately 661 Square Meters) in Tainan, Taiwan. The system integrator adopted Advantech’s APAX-5000 series programmable automation controllers to build the control platform, coupled with Advantech WebAccess HMI/SCADA software, to achieve cloud monitoring. The staff of the orchid field can monitor important data anytime via smart phone, iPad, and other handheld devices, and control the growth and flowering conditions. System requirements: In the past, most environmental control systems of orchid greenhouses in Taiwan used PLCs (Programmable Logic Controller) with poorscalability and control, and could not be connected to the Internet formonitoring from the cloud. For advanced database analysis and networking capability, the PC platform must be adopted. Therefore, PAC Systems (Programmable Automation Controller) with both PLC programming capabilities andPC functions is a better choice.The environmental control of the Orchid greenhouse switches on and off devices like fan, shade net, cooling/heat pump, liquid flow control, water-cooling wall etc. It is controlled by a control panel of electric controllers, and is driven by a motor, to adjust the greenhouse temperature, humidity, and other environmental conditions to the set parameters.
Case Study
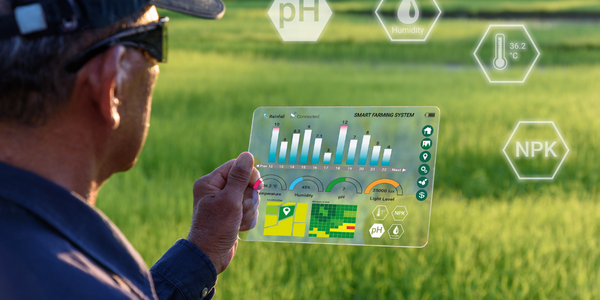
Enabling Internet of Things Innovation in Agriculture
DigiBale, wanted to apply technology know-how and IP from implementations successfully to more agriculture sectors including cotton, forestry, sugarcane and cattle. However, farmers and growers still have worries about the connected technology.

Case Study
Precision beekeeping with wireless temperature monitoring
Honeybees are insects of large economic value and provide a vital service to agriculture by pollinating a variety of crops. In addition, bees provide us with valuable products such as honey, beeswax, propolis, bee venom, etc. Monitoring of honeybee colony health, population, productivity, and environmental conditions affecting the colony health have always been exceedingly difficult tasks in apiculture. Research has shown that even small deviations (by more than 2°C) from the optimal temperatures have a significant influence on the development of the brood and the health of adult bees.
