


下载PDF

Personalizing a Dashboard for 200 Users
技术
- 应用基础设施与中间件 - 数据可视化
- 平台即服务 (PaaS) - 数据管理平台
适用功能
- 商业运营
- 销售与市场营销
用例
- 质量预测分析
- 实时定位系统 (RTLS)
服务
- 云规划/设计/实施服务
- 数据科学服务
挑战
A well-known consumer publisher needed to communicate personalized content performance metrics to their network of 200 affiliated content providers. These affiliated contributors submitted articles and videos for publication on the client’s mobile apps and website, and each contributor needed a filtered dashboard view showing only their KPI charts and graphs in Klipfolio. The team not only needed to put together an effective overall content performance dashboard; they also needed to deliver personalized views of engagement metrics such as page views by user device, user demographics, and top content categories and views to each unique stakeholder. The client had been using standard, outofthebox Google Analytics reports for tracking its website as well as its iOS and Android apps. Additional dashboard data was sourced from the client’s Microsoft Azure database.
关于客户
The customer is a well-known consumer publisher that operates a network of 200 affiliated content providers. These providers contribute articles and videos for publication on the client's mobile apps and website. The client uses standard Google Analytics reports for tracking its website and mobile apps, and sources additional dashboard data from a Microsoft Azure database. The client needed a way to communicate personalized content performance metrics to each of its content providers, who each required a filtered dashboard view showing only their own key performance indicators (KPIs).
解决方案
The team started by implementing Google Tag Manager to simplify the administration of the existing analytics for the customer. This made configuration across the desktop and mobile platforms much easier to manage and provided a solid foundation on which to build the reporting layer. With Tag Manager in place, they customized Google Analytics to capture events, content groupings, and custom dimensions. They also reorganized the account structure for more intuitive Properties and Views. The team then defined the business goals and related KPIs, and designed a layout for the dashboard. They used a Google Sheet as a Data Source for the Klipfolio dashboard, which allowed Klipfolio to filter the data based on the “dimensionN” field. This meant that when a user logged in, the Klips they saw would only contain data that has dimensionN = their unique identifier. The team also provided basic training and documentation to help users take full advantage of the dashboard.
运营影响
数量效益
相关案例.
Case Study
Leading Tools Manufacturer Transforms Operations with IoT
Stanley Black & Decker required transparency of real-time overall equipment effectiveness and line productivity to reduce production line change over time.The goal was to to improve production to schedule, reduce actual labor costs and understanding the effects of shift changes and resource shifts from line to line.
Case Study
IoT Data Analytics Case Study - Packaging Films Manufacturer
The company manufactures packaging films on made to order or configure to order basis. Every order has a different set of requirements from the product characteristics perspective and hence requires machine’s settings to be adjusted accordingly. If the film quality does not meet the required standards, the degraded quality impacts customer delivery causes customer dissatisfaction and results in lower margins. The biggest challenge was to identify the real root cause and devise a remedy for that.
Case Study
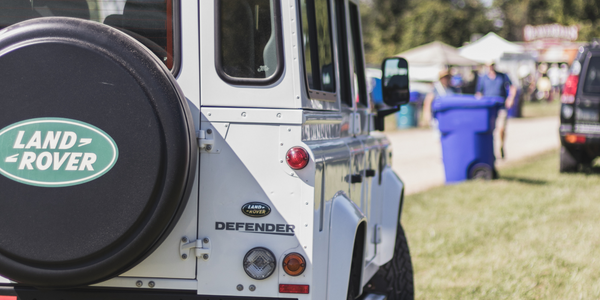
Jaguar Land Rover Speeds Order-to-Cash Cycle
At Jaguar Land Rover, vehicles physically move around the facility for testing, configuration setting, rework and rectification, leading to a longer search time to get each vehicle to its next process facility. The main goal is to minimize the vehicles' dwell time between end of line and the delivery chain which was previously a manually intensive process. Jaguar Land Rover's goal was to build on the success of an earlier RFID project and improve the efficiency of delivering vehicles to meet dealer orders.
Case Study
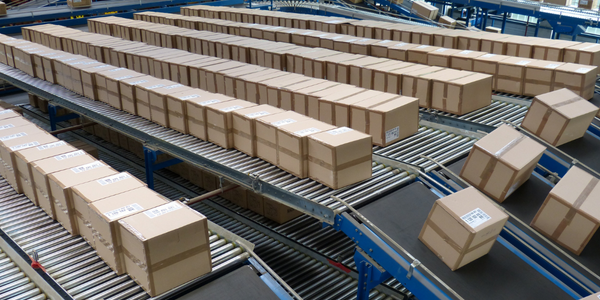
Improve Postal Mail and Package Delivery Company Efficiency and Service
Postal mail and package delivery company wanted to replace legacy yard management system, increase inbound and outbound yard velocity, improve priority parcel delivery time and accuracy, reduce workload and overtime, reduce driver detention and measure performance and utilization of yard resources.

Case Study
Hospital Management Solution
The Oncology Diagnosis and Treatment Center of Brasov wanted to give patients as much freedom to roam as possible, while at the same time ensuring optimal patient safety and security. The centre was in need of an adequate wireless voice communication and messaging solution that would give patients the confi dence that medical staff is always on call, and reduce stress levels of nurses and doctors when called in case of urgent need.
Case Study
Worker Tracking & Safety Monitoring in Construction
One of the main challenges facing the technology was to create a network within underground tunnels and another was to provide products that can withstand harsh working environment. The team used amplifiers to enhance bandwidth and Litum produced IP67-rated hardware that is durable for harsh working conditions.
