


下载PDF

SolarWorld uses FusionCharts to make customers feel proud of their energy-cost savings and reduced carbon count
技术
- 功能应用 - 远程监控系统
适用行业
- 可再生能源
适用功能
- 产品研发
用例
- 能源管理系统
服务
- 软件设计与工程服务
挑战
太阳能设备制造商 SolarWorld 于 2010 年推出了 Suntrol 系统。该数字系统使用板载固件自动记录其太阳能模块的性能。Suntrol 系统的一个组件是 Suntrol 门户,它允许 SolarWorld 系统的所有者分析其太阳能模块的输出。该门户可通过 iPad、iPhone 和 iPod Touch 上的 iTunes 应用程序访问。Suntrol 门户允许用户分析不同时间跨度(从几小时到几个月甚至几年)的功率输出。因此,图表对他们来说是绝对必要的。在获得 FusionCharts 之前,SolarWorld 曾使用过一种开源图表解决方案,该解决方案以位图形式呈现图表。然而,该公司很快就因非交互式位图图表而陷入困境。
关于客户
SolarWorld 是一家太阳能设备制造商。该公司的业务遍布四大洲,包括北美、欧洲、非洲和亚洲。SolarWorld 总部位于德国波恩,在德国、美国和韩国设有制造工厂。他们生产用于屋顶、车棚和露天场地的太阳能模块和基于太阳能技术的发电系统。2010 年 7 月,SolarWorld 推出了 Suntrol,这是一种数字系统,可通过板载固件自动记录其太阳能模块的性能。
解决方案
SolarWorld 决定获得一个交互式图表解决方案,以便于深入分析等。他们选择了 FusionCharts,这是一个帮助为 Web 和桌面应用程序创建动画和交互式 Flash 图表的工具。FusionCharts 能够通过将单调的数据转换为令人兴奋的视觉效果来活跃 SolarWorld 的应用程序。使用 FusionCharts 使 SolarWorld 能够为其用户提供一种更具交互性和吸引力的方式来分析其太阳能模块的输出。这不仅改善了用户体验,还使用户更容易理解和解释数据。
运营影响
相关案例.

Case Study
Remote Monitoring & Predictive Maintenance App for a Solar Energy System
The maintenance & tracking of various modules was an overhead for the customer due to the huge labor costs involved. Being an advanced solar solutions provider, they wanted to ensure early detection of issues and provide the best-in-class customer experience. Hence they wanted to automate the whole process.
Case Study
Vestas: Turning Climate into Capital with Big Data
Making wind a reliable source of energy depends greatly on the placement of the wind turbines used to produce electricity. Turbulence is a significant factor as it strains turbine components, making them more likely to fail. Vestas wanted to pinpoint the optimal location for wind turbines to maximize power generation and reduce energy costs.
Case Study
Siemens Wind Power
Wind provides clean, renewable energy. The core concept is simple: wind turbines spin blades to generate power. However, today's systems are anything but simple. Modern wind turbines have blades that sweep a 120 meter circle, cost more than 1 million dollars and generate multiple megawatts of power. Each turbine may include up to 1,000 sensors and actuators – integrating strain gages, bearing monitors and power conditioning technology. The turbine can control blade speed and power generation by altering the blade pitch and power extraction. Controlling the turbine is a sophisticated job requiring many cooperating processors closing high-speed loops and implementing intelligent monitoring and optimization algorithms. But the real challenge is integrating these turbines so that they work together. A wind farm may include hundreds of turbines. They are often installed in difficult-to-access locations at sea. The farm must implement a fundamentally and truly distributed control system. Like all power systems, the goal of the farm is to match generation to load. A farm with hundreds of turbines must optimize that load by balancing the loading and generation across a wide geography. Wind, of course, is dynamic. Almost every picture of a wind farm shows a calm sea and a setting sun. But things get challenging when a storm goes through the wind farm. In a storm, the control system must decide how to take energy out of gusts to generate constant power. It must intelligently balance load across many turbines. And a critical consideration is the loading and potential damage to a half-billion-dollar installed asset. This is no environment for a slow or undependable control system. Reliability and performance are crucial.
Case Study
Remote Monitoring and Control for a Windmill Generator
As concerns over global warming continue to grow, green technologies are becoming increasingly popular. Wind turbine companies provide an excellent alternative to burning fossil fuels by harnessing kinetic energy from the wind and converting it into electricity. A typical wind farm may include over 80 wind turbines so efficient and reliable networks to manage and control these installations are imperative. Each wind turbine includes a generator and a variety of serial components such as a water cooler, high voltage transformer, ultrasonic wind sensors, yaw gear, blade bearing, pitch cylinder, and hub controller. All of these components are controlled by a PLC and communicate with the ground host. Due to the total integration of these devices into an Ethernet network, one of our customers in the wind turbine industry needed a serial-to-Ethernet solution that can operate reliably for years without interruption.

Case Study
Temperature monitoring for vaccine fridges
Dulas wanted a way to improve the reliability of the cold chain, facilitating maintenance and ensuring fewer vaccines are spoiled. Dulas wanted an M2M solution which would enable them to record and report the temperature inside vaccine refrigerators.
Case Study
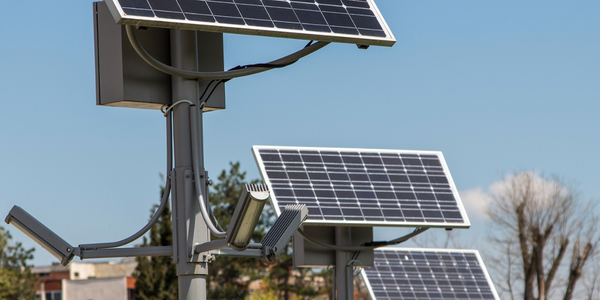
IoT Powering A New Way to Light Streets with Bifacial Solar Panels
When James Meringer’s commercial contracting business experienced a rapid increase in solar projects, he also saw an opportunity to extend the benefits of solar by using the bifacial solar panels he’d become familiar with in new ways. Bifacial solar panels enable sunlight from both sides of the panel, making it a more efficient harvest of solar power. Seeing the panel’s power, James and his team set out to use the same technology for street lighting. Until now, solar street lights have served as utilitarian solutions that force designers to choose between form and function. The Mira Bella Energy team has changed that.
