Gas Pipeline Improves Station Efficiency and Drives Revenue with DataRPM
- Analytics & Modeling - Machine Learning
- Analytics & Modeling - Predictive Analytics
- Oil & Gas
- Maintenance
- Predictive Maintenance
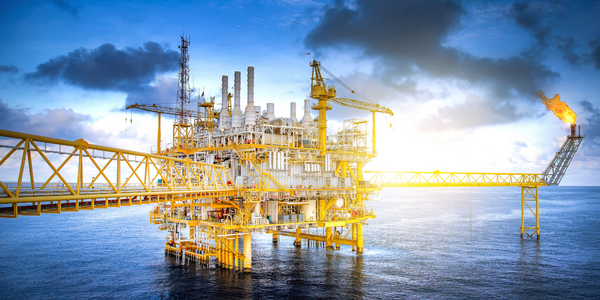
In the capital-intensive oil and gas industry, businesses rely heavily on expensive assets that are deployed in harsh environmental conditions. From a drilling point in the sea to an intermediate station in the desert, the dynamic environmental conditions at each point along the long line affect the performance of the assets deployed along the line. The systems that are used to support these mission-critical assets must also be highly reliable, responsive and secure.
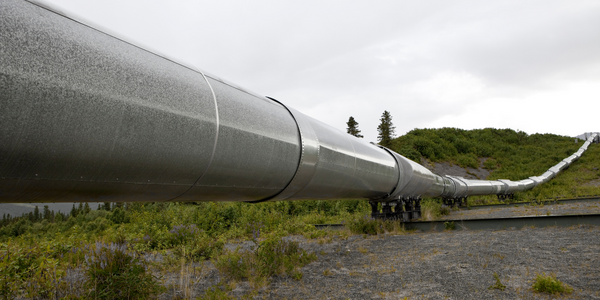
One company that operated a long-distance gas pipeline encountered numerous challenges with the overall efficiency of its pipeline, ranging from sub-optimal usage to wastage of natural resources. Even with the optimal equipment and setup, the wide array of variables in operating conditions combined with the sheer distance covered by the pipeline made running the business difficult.
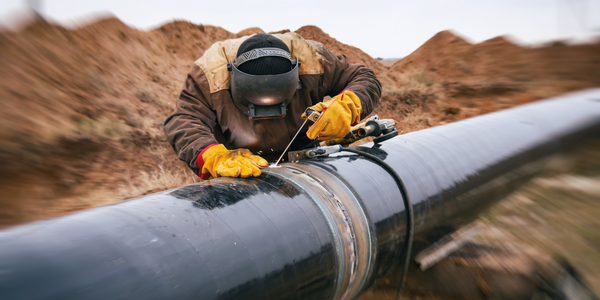
In this case, there were 22 injection stations along the length of the pipeline, operating under very disparate conditions with different efficiencies. This made it difficult to identify the interdependent effectiveness of these injection stations, despite having a large data set on various parameters at each injection substation. Even a single instance of failure could cost the company hundreds of thousands of dollars in lost revenue as well as any additional costs for repairs that had to be made.
The company was spending $5 million per mile of pipeline annually in corrective maintenance. Along with this, the loss of revenue due to the undelivered material was estimated at $250 million. With energy prices dropping, the loss in revenue directly reduced the bottom line of the company. With the clock ticking and revenue dipping, building a perfect efficiency improvement model became a top priority.
The DataRPM CADP solution analyses a large number of variables using multiple data science recipes simultaneously to create a model that forms a highly accurate depiction of how the variables interact with each other. The proprietary self-learning algorithms analyze metadata and run many machine learning experiments in parallel to create the model. Everything learned from the results of the previous run is then applied on future runs to further refine the model. The algorithms and models are optimized to understand what works best on the given set of data. Otherwise, this process could take days or longer if done manually considering there could be multiple points of failures at various transmission stages along the line.
For the analysis, a set of more than 15 features (variables) was used. Data for these features were collected for every hour of every day across a full year for each station and fed into the CADP solution. The model was run to identify the correlation of each of the variables individually, in tandem and in various sub-groups, with the outcome variable, i.e. the efficiency of the end-to-end pipeline. Furthermore, the performance of each station was also correlated with the performance of other variables to identify which stations’ performances were key to predicting the pipeline efficiency. The model was used to predict which stations performed the same as the pipeline and which stations performed the opposite to the pipeline. In some cases, the model predicted the performance of the stations was inversely related to the efficiency of the pipeline.
Related Case Studies.
